Thermal roof inspections are good at finding moisture. But they can’t measure it precisely — and that imprecision has a cost that shows up directly on your remediation bill.
Infrared thermography has been a trusted tool for roof moisture detection for decades. Walk a flat roof at the right time of day, capture the thermal images, mark the wet areas with paint, measure them by hand, and write up the report. The process works — and it’s the basis of ASTM C1153, the industry standard for infrared roof moisture detection. But there’s a gap in what it can deliver, and most building owners never realize it’s there.
the problem
The Measurement Gap Nobody Talks About
When a moisture-affected area is identified on a roof, it gets marked with paint and measured by hand. Those measurements are inherently approximate. Roofs aren’t flat — they have drains, penetrations, HVAC curbs, irregular geometry. A tape measure on an uneven surface doesn’t give you the true area of a thermal anomaly. It gives you a rough estimate.
Because contractors know those measurements aren’t exact, they compensate. They remove more material than the marked area technically requires — a conservative buffer to make sure nothing is missed. Replacement materials get over-ordered for the same reason. On-site crews cut materials to size based on what they find when they arrive, rather than working from pre-cut pieces prepared in advance.
The result: more material than necessary ordered, delivered, and either installed or discarded. More labor time on site. Higher costs passed to the building owner — not because the problem was bigger than expected, but because it couldn’t be measured precisely enough to plan the repair efficiently.
the approach
What Changes When You Add a 3D Point Cloud
At Persase, we’ve developed and validated a process that changes what a thermal roof inspection can deliver — funded by Ørsted and the Long Island Manufacturing Extension Partnership (LIMEP), with approval from NYSTAR.
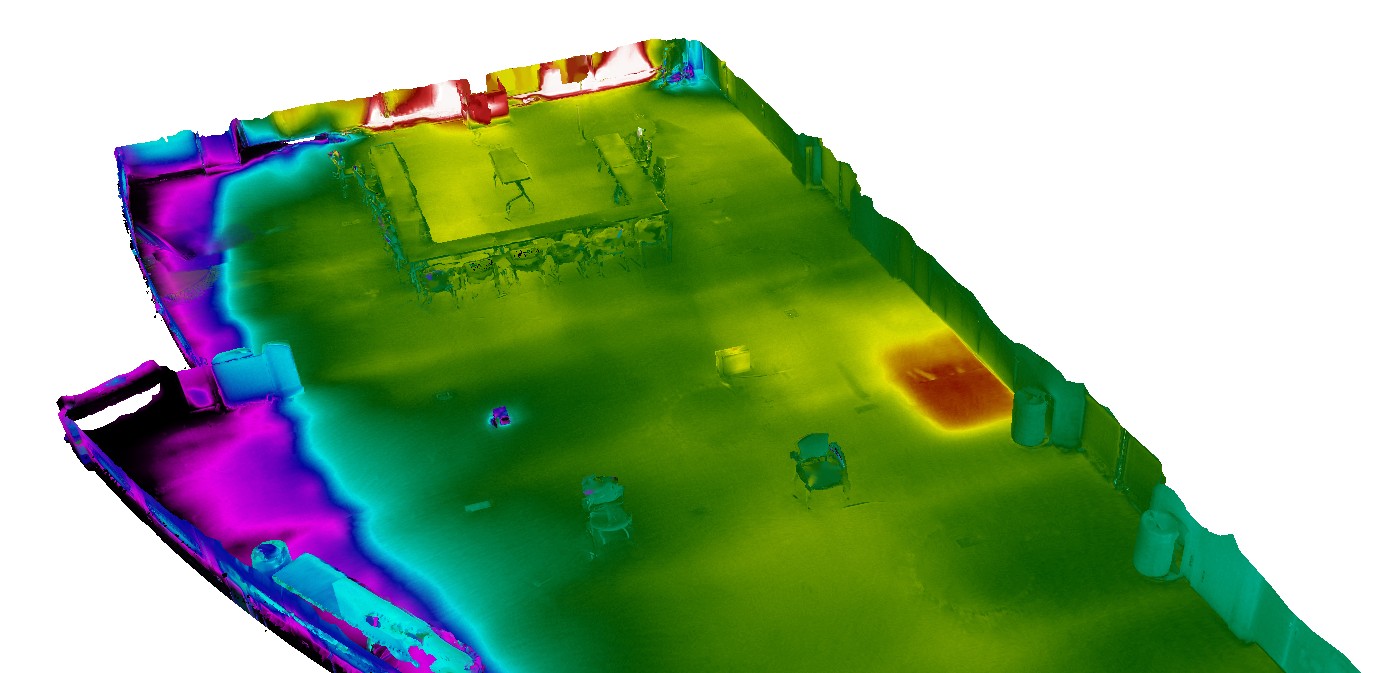
By acquiring a precise laser-scanned 3D point cloud of the roof simultaneously with the thermal images, and then accurately registering the thermal data onto that 3D geometry, we produce something that hasn’t existed before: a georeferenced, dimensionally accurate 3D model of a roof surface with thermal data mapped directly onto it.
The moisture-affected areas aren’t estimated from paint marks and a tape measure. They’re measured from the actual 3D geometry of the roof — exact boundaries, true area calculations, precise spatial coordinates. The data can be exported directly into repair planning workflows. Replacement materials can be quantified accurately and pre-cut before the repair crew shows up.
The inspection report stops being a visual document and becomes an engineering deliverable.
the outcome
What This Means in Practice
Building owners who invest in a precise thermographic point cloud inspection aren’t just getting a better report. They’re getting data they can bring to their contractor, their insurer, and their board with confidence. The numbers are defensible because they come from geometry — not from someone with a can of paint and a measuring tape.
- Precise moisture area measurement — affected areas defined by exact boundaries derived from 3D geometry, not paint markings and tape measures
- More targeted remediation — contractors remove and replace only what needs to be replaced, without a conservative buffer around imprecisely defined areas
- Accurate material takeoffs — replacement roofing and envelope materials estimated and ordered to exact quantities, reducing over-ordering and waste
- Pre-trimmed material preparation — with exact dimensions available before crews arrive, materials can be pre-cut to size, reducing on-site labor time and waste
- Cost savings for building owners — reduced material waste, more targeted repairs, and pre-prepared materials translate directly into lower remediation costs
- A defensible inspection record — a permanent, georeferenced 3D record of the roof’s thermal condition, far more useful for insurance documentation, warranty claims, and contractor briefings than individual thermal images alone
what’s next
Beyond Moisture — Where This Technology Is Going
Roof moisture detection is the first validated application — and the most immediate commercial use case. But the underlying capability — thermal data accurately registered onto precise 3D geometry — has implications that extend well beyond wet insulation.
Energy efficiency analysis is a natural extension. Heat loss through building envelopes, roof-to-wall transitions, penetrations, and aging insulation is visible in thermal imagery. But without spatial precision, it’s hard to quantify the extent of the problem, prioritize repairs, or model the energy impact. A thermographic point cloud of a building envelope changes that — identifying exactly where heat is escaping, measuring the affected area with precision, and providing the spatial data needed to prioritize improvements.
Other applications we’re exploring include structural thermal analysis, solar panel performance audits, cold storage envelope integrity, and any inspection scenario where thermal anomalies need to be precisely located and measured in three-dimensional space. We’re curious where others see the potential — if you work in facilities, construction, energy, or infrastructure, we’d genuinely like to hear what application would matter most to your work.
Related Services & Further Reading
- Thermographic Point Cloud Mapping — Case Study — the full technical breakdown of the R&D project, methodology, and validated results
- Roof Moisture Inspection — ASTM C1153 compliant thermal imaging of flat and low-sloped roofs, now with optional thermographic point cloud overlay
- Building & Site Laser Scanning — precise terrestrial laser scanning of buildings and sites producing dense, accurate point clouds
- Digital Twins — accurate, permanent digital replicas of physical assets combining scan data and visual imagery